The average house price in the UK is £264,500 as of March 2024 (published in April 2024).
Property prices have risen by +0.1% compared to the previous month and fallen by -0.2% (£410) compared to a year ago.
Key figures
Average house price in January 2024 | Average house price in February 2024 | Average house price in March 2024 | Year-on-year change (£) | Year-on-year change (%) | |
All property | £263,800 | £264,200 | £264,500 | -£410 | -0.2% |
Detached houses | £446,400 | £447,000 | £447,800 | -£4,390 | -1.0% |
Flats | £189,900 | £190,200 | £190,500 | -£1,390 | -0.7% |
Semi-detached houses | £268,700 | £269,500 | £270,000 | +£30 | 0.0% |
Terraced houses | £231,900 | £232,400 | £233,000 | +£1,480 | +0.6% |
The graph shows how the UK’s average house price has changed in the last 10 years.
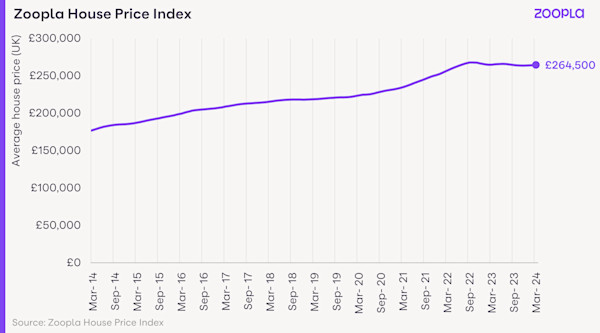
House prices largely unchanged over the last year
Our latest House Price Index shows that house prices are largely unchanged in the year to March 2024, falling by -0.2%.
House prices are continuing to fall across southern England and the East Midlands, although now at a slower pace. The East of England has seen the biggest annual drop at -1.7%.
Market conditions have been improving across the North of England, West Midlands, Wales, Scotland and Northern Ireland, leading to a return of annual house price growth in these regions.
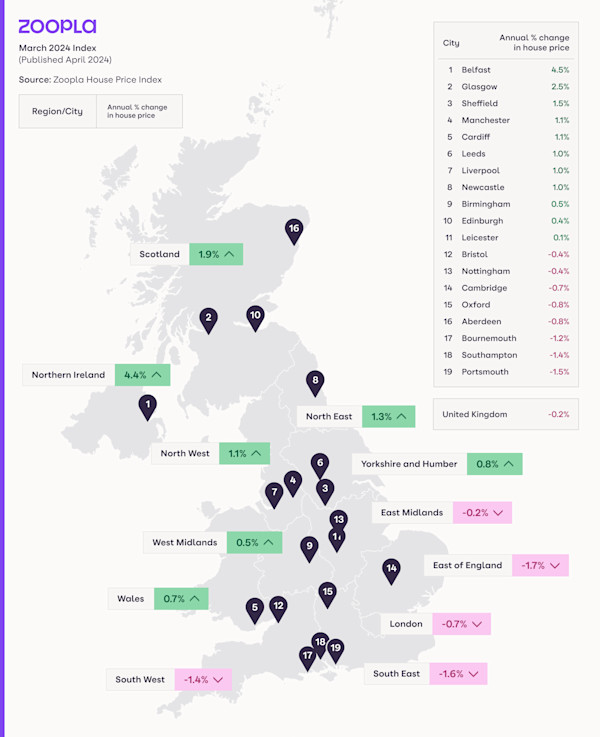
6 in 10 homes are in markets seeing annual house price falls
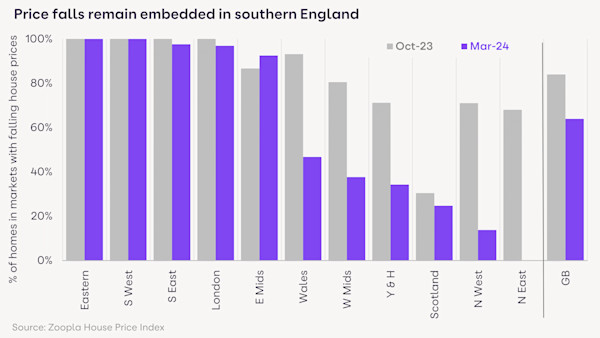
64% of UK homes are in local authority areas where house prices are falling on an annual basis.
But this is lower than the 82% recorded in October 2023, and the scale of price falls is relatively modest. In most cases, house prices in these markets have fallen between -0.1% and -3.0% on average over the year.
What’s more, everywhere in Great Britain outside of the South of England is seeing a decline in the number of homes in falling markets.
There are no local authority areas with falling house prices in the North East, the UK’s most affordable region, where sale prices average £142,000.
It’s a different story in the South of England though, where the proportion of homes in markets with price falls jumps to between 95% and 100%. The East Midlands has 93% of homes in markets with falling house prices.
The chart shows the proportion of homes in markets with falling house prices in each UK region.
Housing market continues to balance
The housing market is more balanced than at any time since before the pandemic. This is likely to give more people the chance to move home in 2024, so long as those selling remain realistic on pricing.
With house price inflation remaining broadly static, affordability for those buying a home is not worsening.
A rebound in sales volumes
The housing market is seeing a sustained uplift in new property sales, with 12% more agreed sales than a year ago.
The number of agreed sales has now been higher than the same time last year for 4 months running.
Sales pipeline rebuilding
The sales pipeline, where we track the number of homes moving through the sale process, is also rebuilding. This comes after a period of fewer sales when mortgage rates jumped in 2022 and 2023.
Our data shows that the housing market is on track for 1.1 million sales completions in 2024, a 10% increase on last year.
Mortgage approvals reach pre-pandemic levels
The recovery in sales numbers is starting to be reflected in other housing data, such as the number of mortgage applications being approved.
According to the Bank of England, there were 32% more mortgage approvals in February 2024 than a year earlier. This is a return to pre-pandemic levels, as the graph below shows.
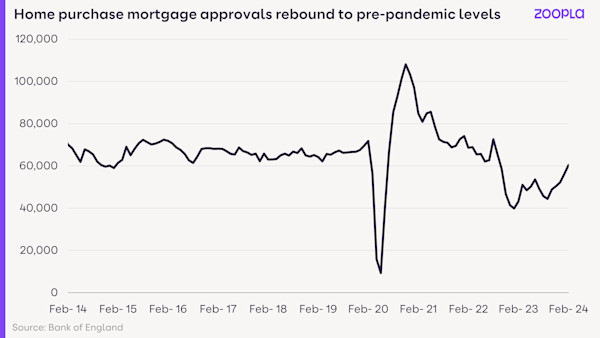
The 4 to 6+ month time lag between agreeing a sale ‘subject to contract’ and moving in means sales completion data is yet to register an upturn. This will emerge in the coming months.
Mortgage rates remain twice as high as 2 years ago
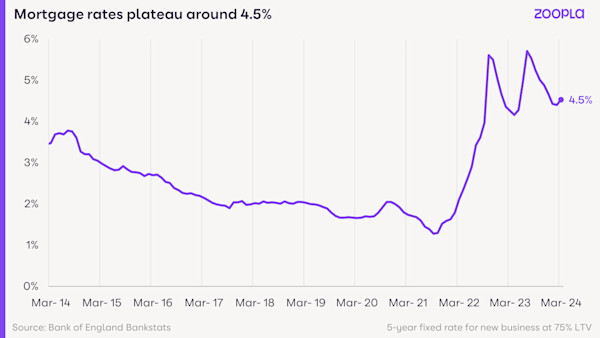
The housing market is continuing to adjust to the end of ultra-low mortgage rates. Mortgage rates spiked twice in the last 2 years - at the end of 2022 and in the summer of 2023 - as interest rates were increased to combat inflation.
The primary impact on the housing market was a -23% drop in sales in 2023, along with modest house price falls. These falls were so small they did very little to improve housing affordability.
Average mortgage rates have started to drift higher in the last few weeks as expectations for interest rate cuts later this year have shifted.
It comes after average mortgage rates for a 5-year fix at 75% loan-to-value fell back to 4.5% over recent months.
I expect mortgage rates to remain around 4.5% throughout 2024, which in my view is consistent with +/-1% house price growth.
Will mortgage rates go down in 2024?
Monthly mortgage costs 60% higher than in 2021
When mortgage rates first started to rise, we reported that the shift from 2% to 5% rates would mean a 30% drop in buying power for the average person.
By ‘buying power’, we mean the price of the property you can afford to buy with a mortgage, assuming you keep your monthly repayments the same.
Buyers withdrew from the market as they faced even higher borrowing costs. Alongside general economic uncertainty, this led to fewer transactions in 2023 and a big slowdown in house price growth.
The housing market is still adjusting to the impact of higher mortgage rates, mainly through static house prices.
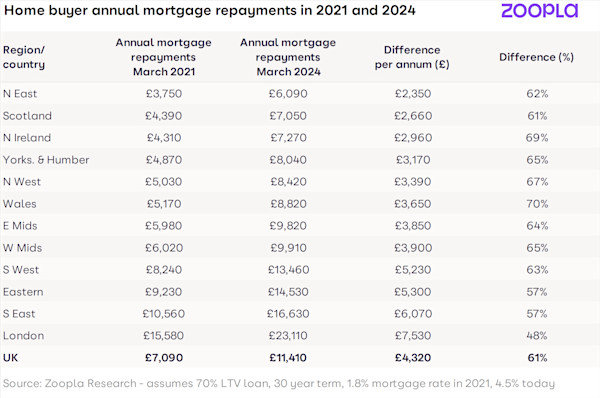
Today, when you compare a sub-2% mortgage rate from March 2021 to the current 4.5% average, the annual mortgage cost jumps from £7,100 to £11,400 - a 61% increase.
(This assumes you buy an average priced home with a 70% loan-to-value ratio on a 30-year term.)
Two thirds of this increase in annual housing costs is a result of higher mortgage rates. One third is down to the fact that house prices are still 13% higher than in March 2021.
While it seems that base rates have peaked and consumer confidence is on the up, mortgage costs for typical buyers are clearly still much higher than 3 years ago.
Higher mortgage rates hit southern England hardest
Across the country, there has been a 50% to 70% increase in annual mortgage repayments for the typical home buyer between 2021 and 2024.
The biggest impact is in the South of England where house prices are higher.
Across the South West, South East and East of England, the annual mortgage cost for an average home is £5,000 higher than previously. This rises to £7,500 in London.
The annual mortgage cost is lower across other parts of the UK, ranging from £2,350 and £3,900. This is one of the reasons that market activity and house prices are holding up better in more affordable markets with lower prices, although household incomes vary by area too.
Stamp duty adds to buying costs in the South of England
It’s not just mortgage costs that impact buying decisions in the housing market. Higher house prices in the South of England also make stamp duty costs higher.
Some 75% of annual stamp duty payments are from home purchases across the South East, South West, London and East of England, while these regions only account for 50% of UK housing sales.
Property buyers look further afield in search of better value
It would be easy to assume that home buyers would look for smaller homes in response to higher mortgage costs. But the profile of what is selling by property type and number of bedrooms remains largely unchanged.
Instead, some home buyers are searching further afield to get what they want at the right price.
Our latest consumer research shows that a third of households that want to move are looking to move out of their local area to secure their next home.
No signs of an uptick in house price inflation
I expect UK house prices to continue to firm over 2024 rather than seeing any acceleration in house price inflation.
The current divergence between the south and the rest of the UK will also continue over the coming months.
With fixed rate mortgages today already reflecting expectations for interest rate reductions later in the year, I don’t expect any major changes in average mortgage rates in 2024.
What the housing market needs most is continued price stability which will create the right environment for continued growth in sales. I believe sales numbers rather than price growth will be the key indicator of housing market health for the foreseeable future.
Download the Zoopla House Price Index: April 2024 (PDF, 408kB)
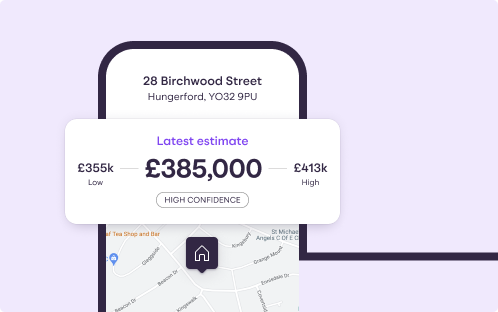
My Home: track your home's value
Discover how much your home could be worth, track its changing value over time and find out what homes in your area have sold for.
Previous House Price Index reports
See more stories from our House Price Index
About our House Price Index
The Zoopla House Price Index (HPI) is a repeat sales-based price index, using sold prices, mortgage valuations and data for recently agreed sales. The index uses more input data than any other and is designed to accurately track the change in pricing for UK housing. It’s a revisionary index and non-seasonally adjusted.
The HPI for April 2024 uses the most recent full data available up to March 2024. We revise previous data where needed to ensure the most accurate representation of the market at any given time.

