Average UK house prices: last 3 months
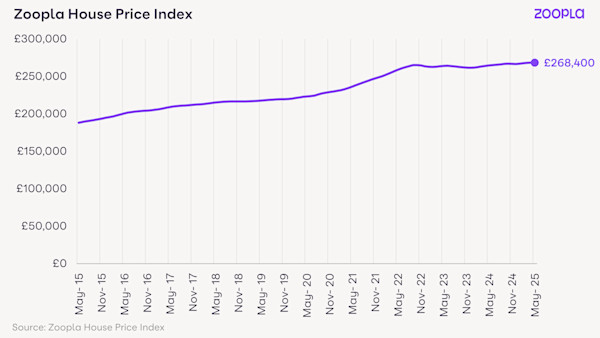
The average house price in the UK is £268,400 as of May 2025 (published June 2025). This is a rise of 1.4% or £3,690 over the past year.
| March 2025 | April 2025 | May 2025 | Annual price change to May 2025 (£) | Annual price change to May 2025 (%) | |
|---|---|---|---|---|---|
| Average UK house price | £268,200 | £268,400 | £268,400 | +£3,690 | +1.4% |
Average house prices by property type: last 3 months
| Property type | March 2025 | April 2025 | May 2025 | Annual price change to May 2025 (£) | Annual price change to May 2025 (%) |
|---|---|---|---|---|---|
| Flats and maisonettes | £191,900 | £191,900 | £191,600 | -£1,450 | -0.8% |
| Terraced houses | £237,100 | £237,200 | £237,200 | +£4,570 | +2.0% |
| Semi-detached houses | £275,100 | £275,100 | £275,100 | +£6,640 | +2.5% |
| Detached houses | £449,200 | £449,300 | £449,300 | +£4,130 | +0.9% |
Track your home's value
See how your estimate is changing every month
Check how your local area’s performing
Explore what’s on the market and what’s sold near you
Find out what local agents think you could sell for
6% more sales as house price growth slows to +1.4%
The number of sales being agreed continues to run at the fastest rate for 4 years. However, this is starting to steady as we begin the seasonal summer slowdown.
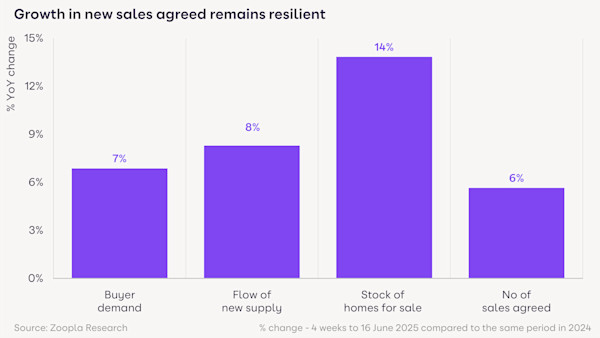
Sales agreed in the last 4 weeks are up 6% on last year, as more homes for sale bring more buyers into the market. There are more sales year-on-year across all regions and countries of the UK.
But more sales doesn’t mean house prices are rising more quickly. In fact, house price growth is slowing, with a rise of just 1.4% in the year to May 2025.
This is higher than the 0.3% increase recorded a year ago but lower than the 2% rise in February.
People continue to be price-sensitive with their moves, with cost of living pressures and higher interest rates impacting affordability. While UK earnings are rising at 5% a year, inflation levels mean further rate cuts are unlikely in the coming months.
These factors are limiting house price growth, despite demand for homes remaining higher than a year ago.
The affordability challenge is particularly stark in housing markets with higher average prices, which creates an additional hurdle for home buyers.
High supply of homes for sale linked to lower house price growth
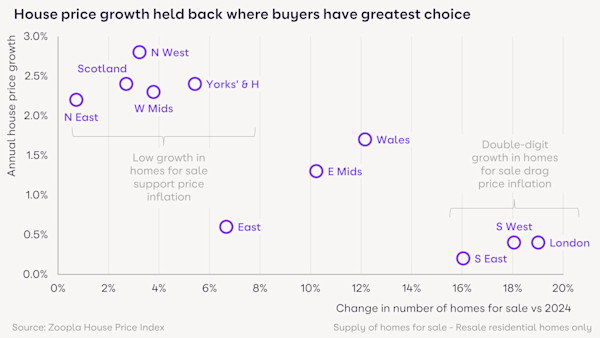
We’re seeing a clear link between the rise in supply and the slowdown in house price growth.
With 14% more homes on the market than a year ago, greater choice for buyers is a key factor holding back house prices.
In London and the South East and South West regions of England, the number of homes for sale is 16-19% higher than a year ago. At the same time, house prices are barely rising - by less than 0.5% over the last year.
In contrast, regions in the North of England, the West Midlands and Scotland have registered only a modest change in supply, creating an element of scarcity. This is supporting above-average price inflation of 2-3%.
Know your budget in 2 minutes
Discover the maximum mortgage you could get
Establish your monthly repayments
See homes you know you can afford
With no fees and no credit checks on your finances.

Affordability is the most important influence on house price growth
In places with cheaper properties, house prices are rising more quickly. On the other hand, expensive areas are seeing slower price rises or even price falls.
House prices rising fastest in affordable areas
House prices are 2.7% higher in markets with average house prices below £200k, and 1.9% higher in markets priced between £200k and £250k. Together, these markets account for 50% of UK homes.
Home values are currently increasing fastest, at over 3.5% per annum, in parts of the North West of England and Scotland, specifically the postal areas of Wigan (WN), Falkirk (FK) and Blackburn (BB).
These cheaper housing markets have remained strong in recent years, even avoiding house price falls in 2023 and early 2024 when mortgage rates jumped to 5-6%.
Small house price falls in expensive areas
Pricier parts of the country are seeing slower growth or modest falls in house prices.
In areas with an average house price of £500k+, house prices are falling by -0.2%. These markets account for only 8% of UK homes.
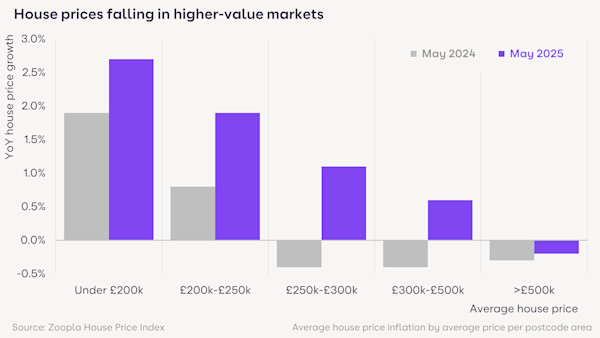
Specifically, house price falls are concentrated in pockets of inner London, the South West and, to a lesser degree, the South East. These spots include:
West Central London (WC postal area, -4.3%)
Torquay (TQ postal area, -1.7%)
West London (W postal area, -1.3%)
Truro (TR postal area, -1.3%)
These markets are subject to other factors too, namely tax and policy changes aimed at second homeowners and landlords. This adds to the affordability issue for buyers and is leading to weaker demand here, compounding the impact on house prices.
Selling your home? Realistic pricing is vital
The key message for sellers is the need to be realistic on pricing if you want to move home in 2025.
Be sure to discuss your marketing strategy with your estate agent, and you could consider adjusting the price to attract more interest. The good news is that there’s demand for homes and a desire to move, but careful pricing is key in the current market.
Curious what your home's worth? Find out instantly
Whether you're ready to sell or just keeping tabs on the market, get a free online valuation of your property in under 60 seconds. No fuss, just numbers.

How long will it take to sell your home?
The average time to sell is 45 days or 7.5 weeks, broadly in line with this time last year. This is the time between a property being listed for sale and being sold subject to contract.
The average time to sell ranges from 35 days in the North East to 57 days in Wales. It takes more than 50 days to sell in all the southern regions of England due to a greater choice of homes for sale.
The market operates differently in Scotland, where the time to sell is just 18 days.
Remember, after an offer is accepted and the property is taken off the market, it can take another 4-5 months to complete a purchase and move in.
Weighing up a timely sale versus a specific price
More than 1 in 5 homes (22%) currently listed for sale have been on the market for more than 6 months and remain unsold.
For sellers, it’s natural to have a price in mind that you want to secure for your home. Or you may have a price you need to unlock your next move.
Keep in mind that you may have to wait longer to achieve your desired price if it’s not in line with your local market.
Ultimately, it might come down to a choice between selling quickly and achieving a specific sale price in the current market.
What’s next for the housing market in 2025?
There’s positive momentum in the UK housing market, with strong sale trends showing a broad desire to move house in 2025.
Buyers will continue to feel the benefits of plenty of choice this year, as well as improved mortgage affordability. This has already given a 20% boost to buying power for those using a mortgage, helping more people make a move in 2025.
If you’re planning to sell your home this year, remember that buyers remain price-sensitive, especially in high-value markets. These areas also face the most competition in terms of the number of homes for sale, so choose an agent with a strong marketing strategy and realistic pricing approach.
Overall, we’ll continue to see a healthy number of sales in 2025 as we remain on track for 5% growth, while house price rises will remain steady in the 1-2% range.
About our House Price Index
The Zoopla House Price Index (HPI) is a repeat sales-based price index, using sold prices, mortgage valuations and data for recently agreed sales. The index uses more input data than any other and is designed to accurately track the change in pricing for UK housing. It’s a revisionary index and non-seasonally adjusted.
Download the full Zoopla House Price Index June 2025 (PDF, 294.19 kB)
Want a second opinion on your home's value?
Get a free in-person valuation from a trusted local agent. No pressure, just expert advice.

Previous House Price Index reports
See more stories from our House Price Index

