Average UK house prices: last 3 months
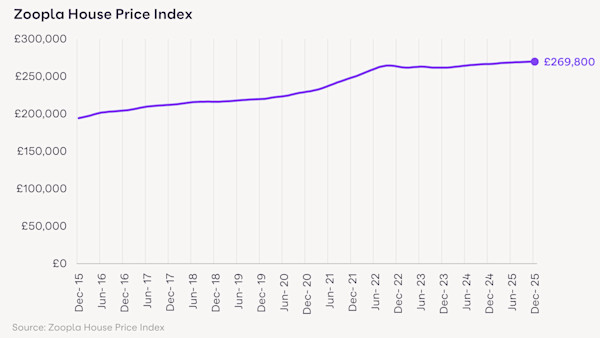
The average house price in the UK is £269,800. This is a rise of 1.2% over the past year.
October 2025 | November 2025 | December 2025 | Annual price change (£) | Annual price change (%) | |
All UK property | £269,700 | £269,800 | £269,800 | £3,190 | 1.20% |
Flats/maisonettes | £191,700 | £191,900 | £191,400 | -£2,810 | -1.40% |
Terraced houses | £238,900 | £238,800 | £239,100 | £3,910 | 1.70% |
Semi-detached houses | £277,500 | £277,600 | £277,800 | £6,080 | 2.20% |
Detached houses | £453,100 | £452,500 | £453,000 | £5,330 | 1.20% |
Strong rebound in demand in line with 2024 levels
The housing market has recorded a strong seasonal increase in buyer interest in January, following a quieter end to 2025.
Many would-be buyers delayed moving decisions late last year due to Budget uncertainty, but our data shows confidence has started to return.
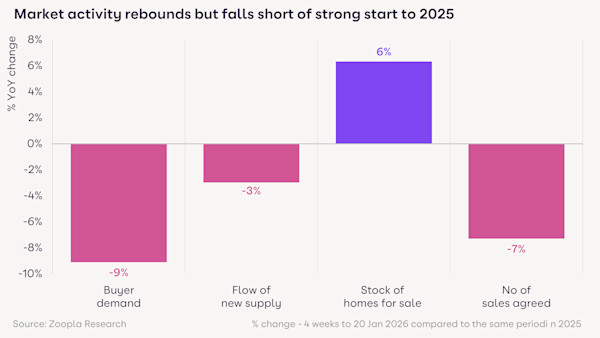
Demand at the start of the year mirrors that of 2024, but it is 9% lower than the very busy start to last year when buyers rushed to beat the ending of stamp duty relief in April.

More buyers means more sellers. And one notable difference to last January is the amount of choice available to buyers.
The total number of homes for sale is 6% higher than last year, with the average estate agent currently marketing 34 properties - the highest level seen in 8 years. This means buyers have more choice, while sellers face more competition.
There’s also been a sharp increase in the number of newly listed homes for sale and more sales being agreed recently, although both measures remain below last year’s levels.
UK house prices rise 1.2% over 2025
The average UK house price increased by 1.2% over 2025 to reach £269,800, a rise of £3,200 over the course of the year.
This rise is lower than the 1.9% increase recorded over 2024.

House price inflation follows a clear north-south divide. The North West of England registered a 3.5% increase in average prices over 2025, followed by a 2.9% increase in house prices across Scotland.
Northern Ireland prices are 7.6% higher, coming off a low base.
London recorded a 0.7% decline in average house prices over 2025 (-0.7%), caused by affordability pressures, higher stamp duty costs and a much greater choice of homes for sale.
The South East and South West saw smaller price falls of -0.1%.
City-level house price rises reflect local affordability
The housing market is very localised and market conditions vary widely around the country. This means you’ll face different considerations for your move depending on where you live: there is no one-size-fits-all for moving house in the UK.
The highest house price growth over 2025 was recorded in Burnley, where prices increased by 5.5%, more than 4 times the national average.
Several other towns and cities across the North West recorded price gains of over 4% including Rochdale, Blackburn, Liverpool and Wigan. All of these towns and cities have average house prices below the regional North West average of £205,400.
Buyers seeking value for money are boosting demand and pushing prices higher, backed by improved mortgage rates and more lenient mortgage affordability checks. At the same time, the number of homes for sale in the North West is 7% lower than a year ago, limiting buyer choice.
House prices have risen across most towns and cities outside of South East England as lower house prices, better affordability and similar levels of supply have resulted in modest house price gains.

Prices falling in cities across south eastern England
House price inflation is weakest in southern England. This reflects higher house prices, which makes buying more expensive in terms of both mortgage payments and stamp duty.
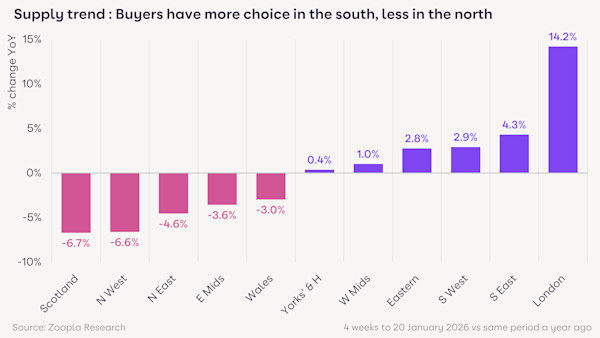
In addition, there is a greater choice of homes for sale than a year ago, reinforcing a buyers’ market.
London has 14% more homes than a year ago, with 3-4% more homes for sale than across other southern regions.
There is demand to buy homes in southern England, but buyers are price sensitive. Most sellers are sitting on sizeable capital gains from their current home, so they need to consider what local buyers may be willing to pay and factor this into the budget for their next home.

Many buyers can now borrow more than a year ago
The last 2 years have seen a strong rebound in sales and households making home moves after the shock of higher mortgage rates in recent years. Last year saw the highest number of sales completed since the pandemic, at 1.2m.
Mortgage rates have stabilised and the mortgage market remains very competitive with more attractive rates for home buyers, especially for those with larger deposits. The average mortgage rate for new loans dropped to 4% in December, its lowest level since September 2022.
In addition, many households can borrow up to 20% more with the same income and mortgage rate than a year ago, which has supported more home moves and higher prices where affordability and buying costs allow. Understanding what you could afford is an important step in planning your next move.
What’s next for the UK housing market?
More homes for sale means more buyers in the market. This shows the desire to move home remains, but you must factor in local market conditions if you’re planning to sell. Speak to local agents to discuss how to price your home to attract good levels of buyer interest.
We expect current trends in market activity to continue over the early part of the year, with healthy demand for homes that are well priced.

About the Zoopla House Price Index
The Zoopla House Price Index (HPI) tracks the change in achieved sales price of homes (it’s not an index that tracks asking prices). The index uses sold prices, mortgage valuations and data for recently agreed sales with more input data than any other index. The methodology is designed to accurately track the change in pricing for UK housing. It’s revisionary and non-seasonally adjusted.
Download the House Price Index January 2026 (PDF, 405kB)
Additional notes on this month’s data:
Buyer demand refers to the 4 weeks to 20 January 2026 vs the same period in 2025.
Number of homes for sale refers to the 4 weeks to 20 January 2026 vs the same period in 2025.
Previous House Price Index reports
See more stories from our House Price Index


