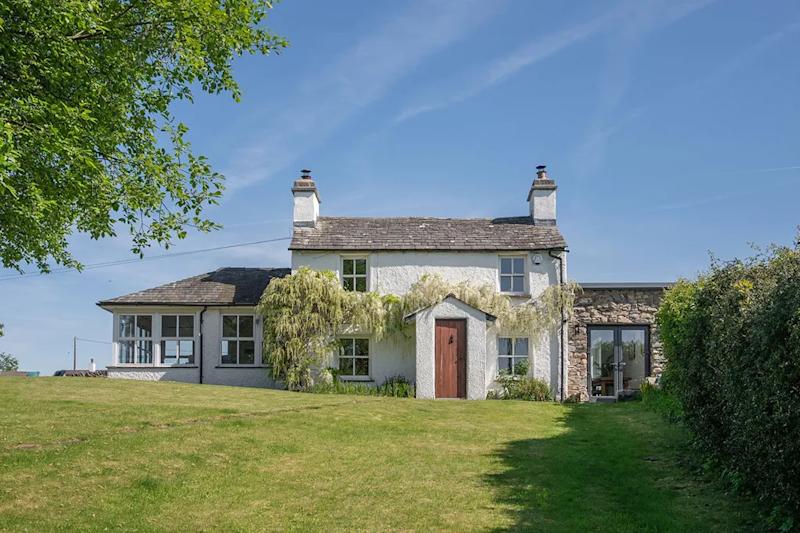
On the hunt for a home in the North West that won’t break the budget? Get the lowdown on house prices across the region, from the cheapest spots to the most expensive.
Buying, selling or renting? Explore the latest property news, market updates and insightful analysis for the UK housing market with Zoopla's property experts.

On the hunt for a home in the North West that won’t break the budget? Get the lowdown on house prices across the region, from the cheapest spots to the most expensive.
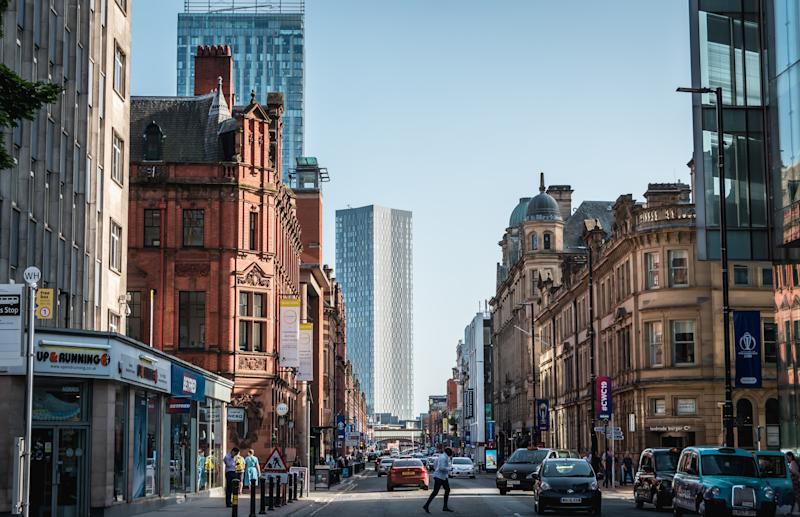
We unpack house prices across Greater Manchester, from the cheapest spots to the most expensive.
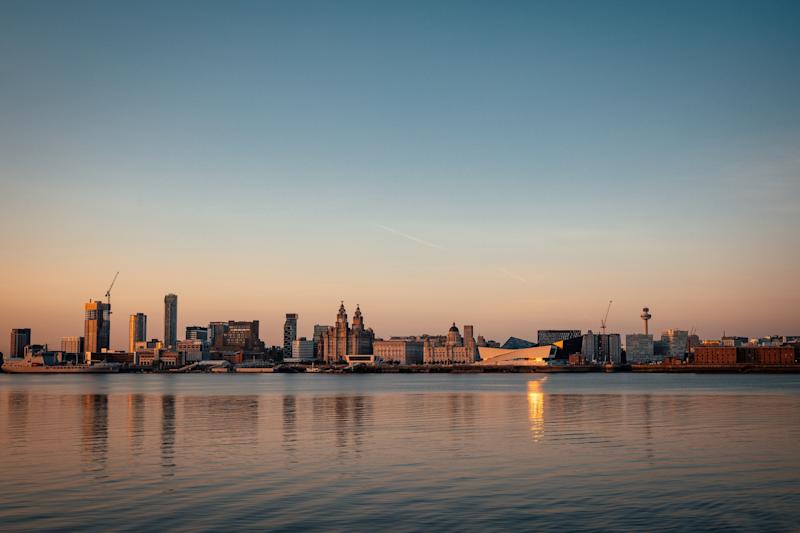
Liverpool is one of the cheapest places to buy a home in the North West, proving a city lifestyle can go hand-in-hand with affordable house prices.
More sales, rising supply, plenty of demand and modest house price growth shape a steady UK housing market in June 2025.
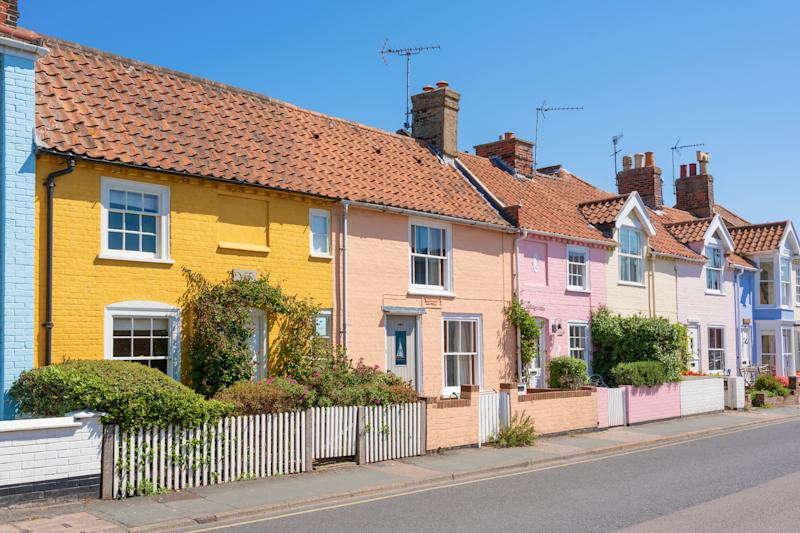
Two decades of rising house prices may be pricing Brits out of the places they once called home.

From sunny gardens to cool pools: some property features can add thousands to a home’s price tag in the summer.
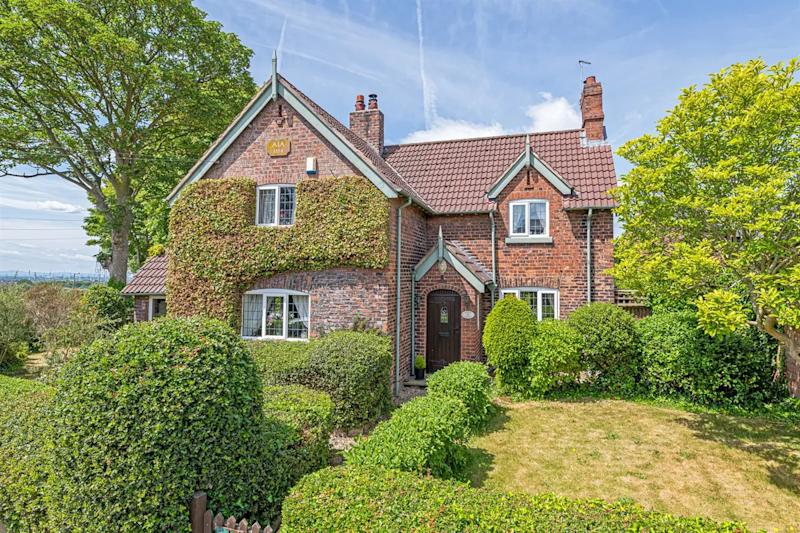
The North West of England has the hottest housing market in the UK right now, with homes selling in just 27 days. Let’s break down the hotspots where homes are selling the quickest in the North West.

Rents are rising at the slowest pace for 4 years as the supply and demand imbalance narrows. This is welcome news but strong competition for rented homes remains.

Gen H have launched their New Build Boost mortgage scheme in an effort to make homeownership more accessible. The scheme is modelled on the previous Help to Buy scheme, but how does it compare?